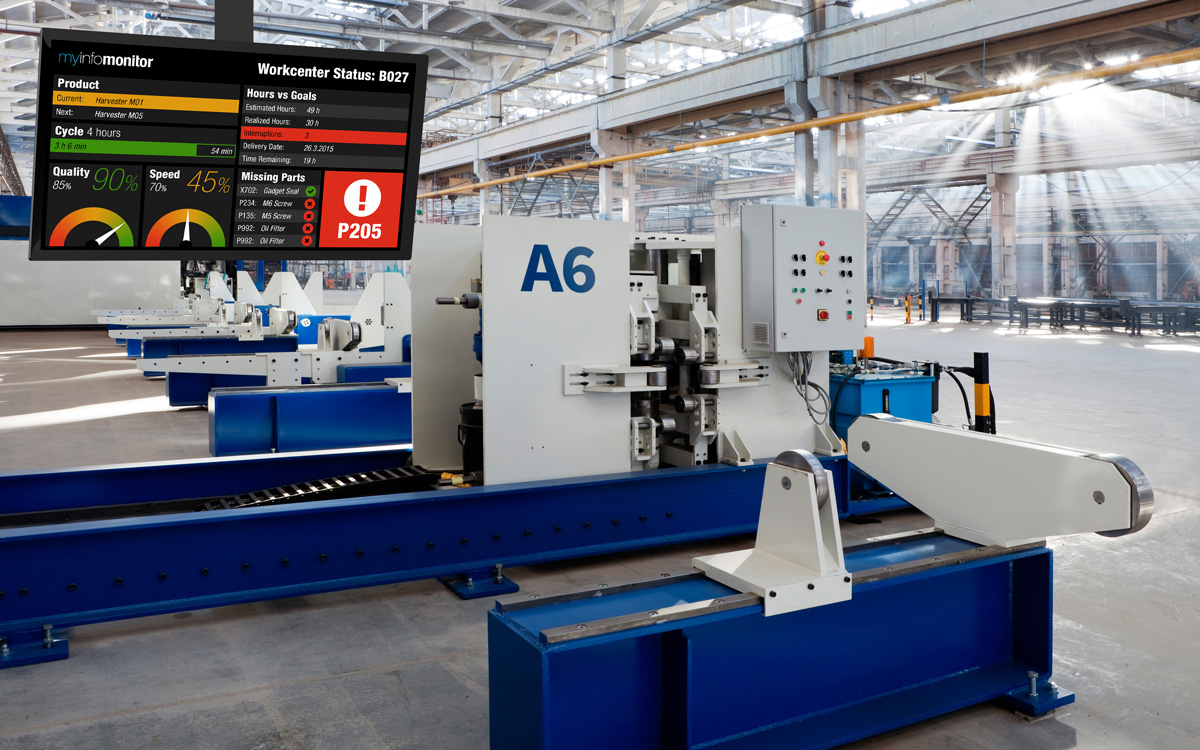
Real-time data is always available for fast decisionsOur solutions make sure that your dashboards and data-driven infographics are up to date the second data changes in any of the underlaying systems. Then the content is delivered to any device and large format screens for instant noticeability and proactive measures.
|
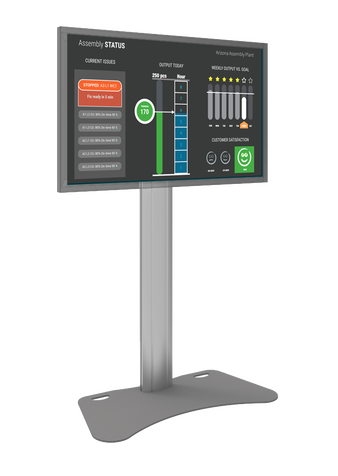
Increased agility and continuous improvementWhen everyone has the same situational picture and processes are managed by making it impossible to do wrong, the efficiency will have a substantial increase.
The agility of the organisation, the departments and teams are increased by having the real-time insights available in a simple visual format. |
Detect and address operational issuesNon-expected situations should be caught by preventive analysis, but when this fails the situation must be communicated automatically and ideally with information on how to address the situation at hand.
It should be possible to create and change triggers that will signal an alert when unwanted situations are predicted or have already started. |
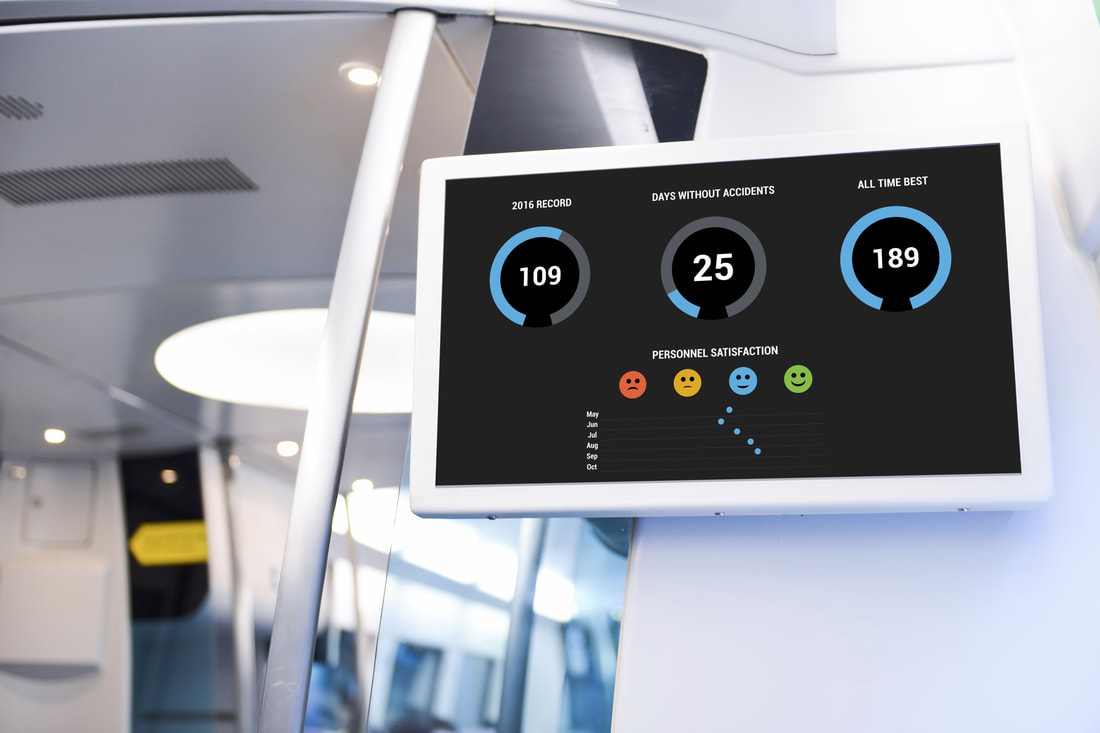
Act on short-term changesBy making the daily (or hourly) situation visible throughout organization makes it possible to act on short term changes – or to get changers to happen in the organization by automating onboarding with better and automated communication, instant feedback and positive motivational or gamified experiences.
|
Personalize and target the insights
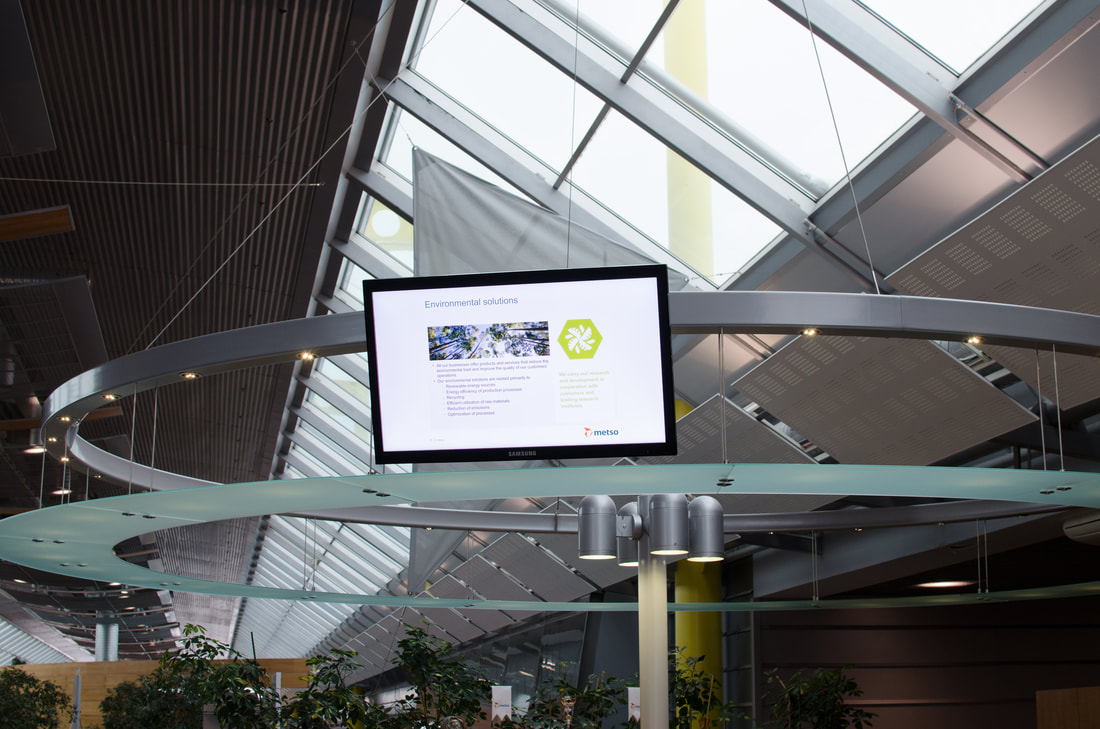
The best way to deliver a message is to show it in a visual way that was designed and planned for the audience that will see it, understand it and act upon it.
Typically this is not economically possible and usually the information and insights are either abstracted into reports that really don't have that much impact or just shown as KPIs that people can undertand but that aren't really directly related to what they can changer during the working day.
Please feel free to contact us and let us show how we can get your organisations data to flow freely into actionable visual insights.